Why Is Product Weight Uneven in Auger Fillers?

Time:2026-09-13 Author:Madeline
0%

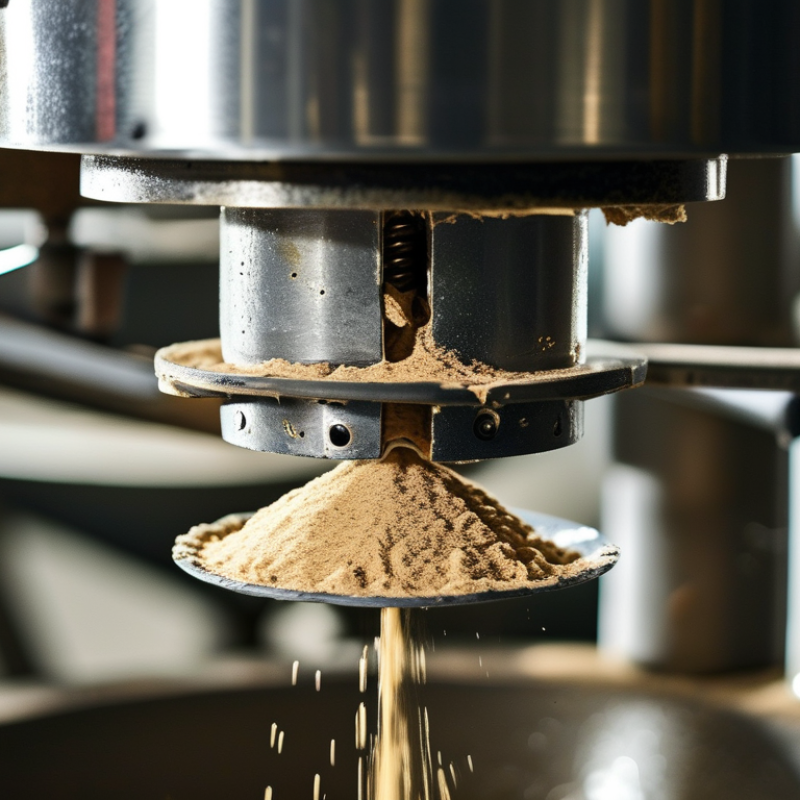
Uneven product weight in an auger filler can appear as a small variation, yet it may reveal a deeper process problem. One container feels light, while the next feels noticeably dense. Operators often notice this during routine checkweighing, especially when powder gathers around the auger flight or funnel wall. Understanding what causes uneven product weight in auger fillers requires attention to the material, machine settings, and operating conditions together.

Powder behavior is rarely perfectly consistent. Moisture, particle size, bulk density, and flowability can change during one production run. A partially bridged hopper may feed the auger unevenly. Excessive vibration can also alter the powder’s packing pattern. Meanwhile, an incorrect auger speed, poor fill-time setting, or worn flight can create unstable dosing. Small details matter. A loose coupling matters.

Experienced technicians usually begin with simple observations. They compare filled weights over several consecutive cycles, inspect the hopper surface, and check whether powder feeds smoothly. They also confirm that the auger, funnel, and seals are clean and correctly installed. Calibration should be verified with a suitable scale, not assumed from the previous shift. That assumption causes trouble. Even reliable equipment needs review when the product changes.

This guide explores the main reasons for inconsistent auger-filler weights and explains practical inspection methods. It also considers less obvious influences, including powder aeration, temperature, and operator adjustments. Some problems may resist a quick fix. Careful measurement, documented settings, and controlled testing provide a more reliable path than repeated guesswork.
Why Is Product Weight Uneven in Auger Fillers?

Auger Filler Weight Accuracy: Typical Tolerances of ±0.5%–1.0%

Why Is Product Weight Uneven in Auger Fillers?

Auger filler accuracy commonly falls within ±0.5%–1.0% under stable production conditions. This range is a practical benchmark, not a universal guarantee. Powder density, particle size, moisture, and flow behavior can shift each dose.

A 500-gram target may therefore vary by 2.5–5 grams. That difference becomes visible when operators compare containers on a calibrated scale. The Packaging Machinery Manufacturers Institute identifies material consistency and equipment setup as major factors in filling performance. NIST Handbook 44 also stresses regular scale verification, repeatability checks, and controlled operating conditions.

Small changes matter.

An auger may rotate consistently, yet deliver different mass when powder bridges above the screw. Vibration can compact the material. Humidity can create clumps around the hopper wall. A worn auger flight may also reduce repeatability, although this problem is often missed during routine inspections.

Experienced technicians usually test several consecutive fills, not one sample. They record average weight, standard deviation, and the heaviest deviation. The European Commission’s prepacked-goods guidance supports this approach by separating average quantity control from individual package errors.

Still, ±0.5% is not always realistic. Fine powders may need slower feeding, agitation, and frequent density checks. A careless assumption here can produce impressive numbers on paper and unstable results on the line.

How Powder Flowability and Bulk Density Cause Weight Variation

Why Is Product Weight Uneven in Auger Fillers?

How Powder Flowability and Bulk Density Cause Weight Variation

Uneven auger-filler weights often begin with powder flowability. A cohesive powder may bridge above the screw. A free-flowing powder can flood the flighting instead. The Carr Index helps quantify this behavior. Values above 25% usually indicate poor flow, while Hausner ratios above 1.25 suggest higher cohesiveness. These widely used ranges appear in powder-handling guidance and align with USP General Chapter <1174>.

Bulk density creates another direct problem. If a one-liter hopper sample changes from 0.45 to 0.50 g/mL, the same volume gains 50 grams. The auger may rotate consistently, yet the fill weight still moves. Vibration, humidity, particle size, and refill height can change tapped and aerated density. ASTM D7481 recommends shear testing for evaluating powder behavior under controlled stress. That matters because a powder can look stable in a laboratory beaker but behave differently inside a running hopper.

A practical check should record weight, moisture, bulk density, and torque together. Operators should sample at the beginning, middle, and end of a production run. Small changes can reveal a larger pattern. Yet this method is not perfect. Sampling itself may compact the powder. Even a careful test can miss segregation near the auger inlet. A sensible adjustment may include gentler agitation, stable refill levels, and revised auger speeds. Never change speed alone without reviewing density data.

Why Is Product Weight Uneven in Auger Fillers? - How Powder Flowability and Bulk Density Cause Weight Variation

Powder Type Flowability Level Angle of Repose
(°)
Carr Index
(%)
Bulk Density
(g/mL)
Target Fill
(g)
Average Fill
(g)
Weight CV
(%)
Typical Variation Cause Recommended Control
Free-flowing crystalline powder Good 28–32 10–15 0.70–0.85 100 99.8 0.6 Minor changes in hopper head pressure and screw refill timing Maintain a consistent powder level and use a stable screw speed
Granulated powder Good 30–35 12–18 0.55–0.70 100 100.2 0.8 Granule-size distribution and occasional bridging above the screw Control granule size and use gentle agitation when necessary
Fine cohesive powder Fair 36–42 20–28 0.35–0.50 100 98.9 1.8 Powder adhesion, rat-holing, and inconsistent screw-filling density Use controlled agitation, deaeration, and a slower refill cycle
Very fine low-density powder Fair to poor 40–48 28–38 0.20–0.35 100 97.6 2.7 Air entrainment, compaction changes, and unstable powder drawdown Apply deaeration, reduce vibration, and monitor settled density
Moisture-sensitive powder Variable 34–45 18–34 0.40–0.65 100 100.7 2.1 Humidity-driven agglomeration and changes in apparent bulk density Control room humidity and verify moisture before production
Fibrous or irregular particles Poor 42–55 30–45 0.25–0.45 100 96.8 3.4 Interlocking particles, uneven screw loading, and intermittent flow Improve particle-size uniformity and select a suitable screw geometry
Powder after excessive vibration Changed 32–44 16–32 0.45–0.75 100 101.3 2.4 Powder consolidation increases the mass held in each screw volume Use only the minimum vibration needed to prevent bridging
Conditioned, de-aerated powder Good 30–36 12–20 0.50–0.75 100 100.1 0.9 More uniform packing reduces the mass difference between successive screw flights Standardize conditioning time, sieve control, and hopper level

Note: The ranges are representative powder-processing benchmarks. Actual weight variation depends on particle-size distribution, moisture, screw design, fill level, speed, vibration, and machine setup.

The Role of Screw Design, Speed, and Fill Depth in Dose Consistency

Why Is Product Weight Uneven in Auger Fillers?

Screw design strongly influences dose consistency. A flight with uneven pitch can push more powder near the outlet. Tapered screws often improve control for fine powders, while constant-pitch screws may suit free-flowing materials. The International Society for Pharmaceutical Engineering recommends evaluating powder flow, segregation, and equipment geometry during dispensing studies. That advice matters. Two powders can look identical but behave differently inside the hopper.

Speed creates another variable. Higher revolutions may increase output, yet they can also compress powder and cause surging. In a 2023 process-validation dataset reported through Powder & Bulk Solids, operators commonly examined weight variation across low, medium, and high screw speeds rather than selecting speed by capacity alone. A practical target is often a coefficient of variation near or below 1%, but this is not universal. Moisture, particle size, and aeration can shift the result.

Fill depth is easy to underestimate. A shallow hopper level reduces the pressure above the screw. A deep level can compact the powder and alter bulk density. Keep the fill line steady. Test at several depths, such as 25%, 50%, and 75% of hopper capacity. Weigh at least 30 consecutive doses for each condition, following common statistical validation practice described in ASTM E2709. The uncomfortable finding is often clear: the “best” speed changes when fill depth changes. Operators should record temperature, moisture, refill timing, and stoppages. Small details matter.

Why Hopper Level and Powder Bridging Affect Auger Filling Accuracy

Why Is Product Weight Uneven in Auger Fillers?

Hopper level strongly affects auger filler accuracy. When the powder level drops, pressure above the auger decreases. The powder may enter the screw less consistently. This changes the volume carried during each rotation.

A high hopper level can also compress powder near the auger inlet. That compression may increase bulk density and produce heavier fills. A low level may cause lighter fills, especially with fine or cohesive powders. Small changes become visible on the checkweigher.

Powder bridging creates another problem. A crust can form across the hopper opening while the material below continues flowing. The surface may look stable, but the auger receives uneven powder. Bridging often appears with powders containing moisture, static charge, or irregular particles. Watch for sudden weight drift.

In production checks, operators should record hopper level, auger speed, and fill weight together. These details reveal patterns that a single weight reading can hide. Gentle agitation can break bridges, but excessive movement may alter powder density. That trade-off is easy to overlook.

The ideal hopper level is not always the highest one. It should remain stable without compressing the product excessively. Weigh several consecutive fills after each adjustment. One good sample proves very little. My own checks sometimes exposed a faulty assumption: the auger was blamed, while the real issue was an unstable powder surface.

Statistical Checks: Using 30+ Samples to Identify Weight Unevenness

Why Is Product Weight Uneven in Auger Fillers?

Weight variation often appears random, but a 30-sample check can reveal a pattern.

During a production trial, collect at least 30 consecutive containers from the same filling run. Do not select only visually perfect samples. Record each weight to the nearest scale division, along with the auger speed, fill time, and hopper level.

Calculate the average, minimum, maximum, standard deviation, and coefficient of variation.

The average shows the general filling level. The range exposes sudden differences. Standard deviation shows how widely results move around the average. A rising coefficient of variation may indicate inconsistent powder flow, bridging, vibration, or changing bulk density.

Look closely at the sequence. Ten light samples followed by ten heavy samples suggest a trend, not simple random noise.

Check the equipment physically.

Powder may cling to the hopper wall, while a partially empty hopper changes pressure above the auger. Inspect the auger flight, outlet, seals, and powder path for buildup.

Then repeat the 30-sample test after one adjustment only. Changing speed, fill time, and vibration together weakens the evidence.

Small details matter. A warm room can alter powder behavior. Humidity may create clumps. An operator’s manual top-up can also disturb results.

My own early trials sometimes treated the average as proof of stability. That was a mistake. A good average can hide alternating heavy and light fills.

Use a simple run chart, keep the original records, and question any result that looks unusually tidy.

FAQS

Why can auger fillers produce uneven product weights?

Powder flowability affects how consistently material enters the screw. Cohesive powder may bridge, while free-flowing powder may flood the flights.

How does bulk density change fill weight?

The same auger volume can hold different masses. For example, density rising from 0.45 to 0.50 g/mL adds 50 grams per liter.

What signs suggest poor powder flow?

A Carr Index above 25% often indicates poor flow. A Hausner ratio above 1.25 suggests stronger powder cohesiveness.

How does hopper level affect filling accuracy?

A high level can compress powder near the inlet and create heavier fills. A low level may reduce feeding consistency and produce lighter fills.

What is powder bridging?

Bridging is a crust across the hopper opening. The surface looks stable, but uneven powder reaches the auger below.

Which conditions encourage bridging?

Moisture, static charge, and irregular particles can encourage bridging. Fine powders often deserve closer observation.

How can operators investigate weight variation?

Collect at least 30 consecutive samples from one run. Record weight, auger speed, fill time, and hopper level.

What statistics should a 30-sample check include?

Calculate the average, minimum, maximum, standard deviation, and coefficient of variation. Review the sequence, not only the average.

Why can a good average hide a problem?

Alternating heavy and light fills may produce an acceptable average. A run chart can expose this hidden pattern.

What adjustments may improve consistency?

Try stable refill levels, gentler agitation, and carefully revised auger speeds. Change one factor at a time. One test is not enough.

Conclusion

Uneven product weight in auger fillers is usually caused by changes in powder behavior and machine settings. The phrase what causes uneven product weight in auger fillers can be explained by several factors, including poor flowability, inconsistent bulk density, and powder that does not feed smoothly into the screw. Screw design, rotation speed, and fill depth also influence how much material is delivered in each cycle. When these conditions are properly balanced, typical auger filler accuracy may remain within approximately ±0.5% to ±1.0%, depending on the product and application.

Hopper conditions are equally important. A changing powder level can alter pressure above the screw, while bridging or rat-holing may interrupt the material supply and create dose variation. To identify whether weight unevenness is occasional or systematic, operators should collect and review at least 30 samples. Statistical checks of the average, range, and spread can reveal patterns and help determine whether adjustments to the powder preparation, screw settings, or hopper operation are needed.

Madeline

Madeline

Madeline is a dedicated marketing professional with a wealth of expertise in our company's core offerings. With a keen understanding of the industry, she brings a unique perspective to her role, consistently delivering high-quality content that highlights the superior aspects of our products. As......