2026 Best Ways to Reduce Product Giveaway in Filling Lines?

Time:2026-09-18 Author:Aria
0%

Product giveaway can quietly drain margin on every filling shift. A few extra grams per container may seem harmless, yet thousands of units can turn small errors into major annual losses. The 2024 PMMI State of the Industry reports continued pressure on manufacturers to improve efficiency, labor productivity, and automation performance. These pressures make “how to reduce product giveaway in filling lines” a practical financial question, not merely a quality project.

OEE data from the OEE Foundation places average manufacturing effectiveness near 60%, while world-class performance approaches 85%. Filling operations rarely lose efficiency through one dramatic failure. Instead, losses often hide inside unstable product density, delayed valve shutoff, worn seals, air bubbles, temperature changes, and poorly controlled checkweigher feedback. The scale is visible: a 2-gram overfill across 100,000 containers equals 200 kilograms of product.

As lean manufacturing expert John Shook has said, “Without standards, there can be no improvement.” That principle applies directly to filling accuracy. Operators need a clear target, repeatable sampling, calibrated scales, and traceable adjustments. A useful starting point is measuring giveaway by product, nozzle, shift, and batch. Not every line needs an expensive redesign. Sometimes, a cleaner hopper, steadier pressure, or tighter calibration reveals the real issue.

Still, measurement alone is not enough. Teams must question their assumptions. A setting that worked last month may fail after a product reformulation. This guide examines practical controls, smarter feedback systems, preventive maintenance, and operator habits that can reduce giveaway without creating underfilled packages or slowing production.
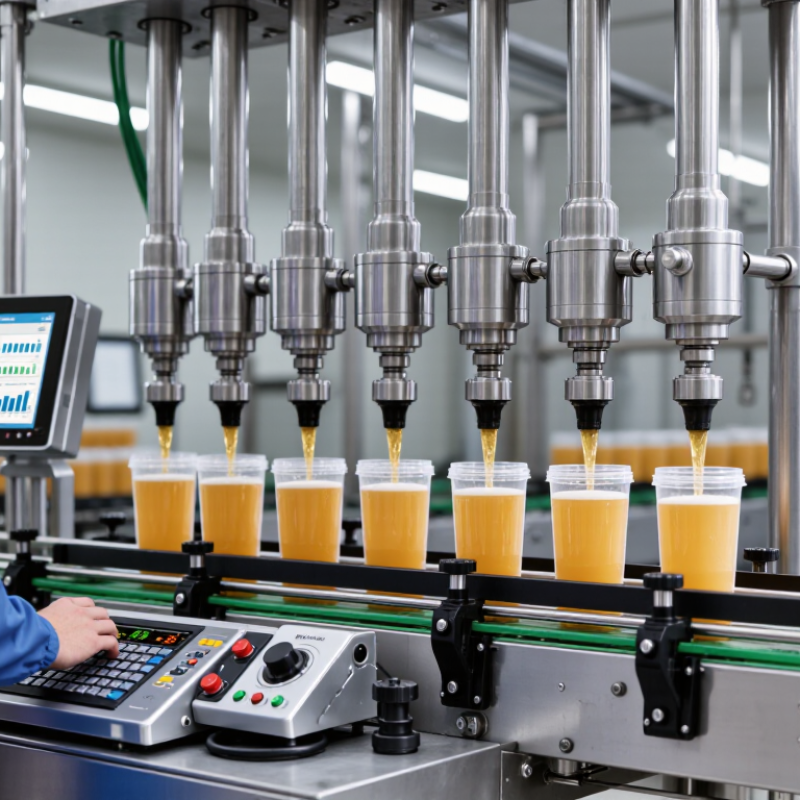
2026 Best Ways to Reduce Product Giveaway in Filling Lines?

Define Product Giveaway and Baseline Losses with NIST Handbook 133

In 2026, reducing product giveaway begins with a precise definition. Product giveaway is the product supplied above the declared net quantity. A few extra grams may seem harmless. Across thousands of packages, they become measurable loss. NIST Handbook 133 provides practical procedures for checking net contents, package errors, and average quantity. It also helps teams separate true giveaway from normal filling variation.

Build a baseline before changing equipment or targets. Select representative samples from different shifts, products, and operators. Record gross weight, tare weight, net weight, temperature, and filling speed. Use calibrated scales and consistent sampling conditions. Compare the results with the declared quantity and applicable Maximum Allowable Variation. Keep the original data, not only the final average. Averages can hide short-term overfilling.

A useful baseline might show a 500-gram package averaging 506 grams. That six-gram difference is the starting point for investigation. Check whether it comes from nozzle drip, unstable product flow, container variation, or cautious settings. Then track giveaway by line and production hour. Small changes often reveal patterns. Do not assume the highest fill setting is safest. It may protect against underweight packages, but it can quietly increase material costs. Operators may also adjust settings differently, which makes comparisons less reliable. Review the method regularly. The baseline may be accurate, but not perfect.

Measure Fill Variation Using SPC and Six Sigma’s 3.4 DPMO Benchmark

Reducing Product Giveaway in Filling Lines: Measure Variation with SPC

Product giveaway often hides inside normal-looking production data. A 500 mL filler may average 501.8 mL while producing thousands of excess milliliters each shift. Track every sample, not only the daily average.

Operators can collect ten containers every 15 minutes and record fill weight, temperature, nozzle position, and machine speed.

An X-bar and R chart then separates routine variation from special causes. NIST/SEMATECH’s e-Handbook recommends control charts for this exact distinction.

The Six Sigma Body of Knowledge defines world-class performance as 3.4 defects per million opportunities, or DPMO. This benchmark is useful, but it needs careful interpretation.

One container can have several opportunities, including weight, seal, and label defects. For fill control, calculate DPMO using a clearly defined fill specification.

OIML R 87:2016 also provides recognized guidance for average quantity and package variation. Small drift matters.

Record everything.

A capable process should show stable control before capability indices are trusted. Calculate Cp and Cpk only after removing special-cause signals.

A Cpk below 1.33 deserves investigation, while a higher value does not guarantee zero giveaway. That assumption is flawed.

Our sampling plan may also be too slow for a rapidly changing filler. Review the chart beside the machine, inspect nozzles physically, and compare actual output with target settings.

Data reveals the problem, but disciplined observation often explains it.

Calibrate Load Cells and Checkweighers Under OIML R 61 Accuracy Classes

Product giveaway often begins with a small weighing error. Repeated across thousands of packs, it becomes expensive. The UNEP Food Waste Index Report 2024 estimated 1.05 billion tonnes of food were wasted in 2022. Accurate filling deserves daily attention.

OIML R 61 applies to automatic gravimetric filling instruments. Its accuracy classes, including X(1) and X(2), help define acceptable filling performance. Select the class according to product value, flow behavior, and required tolerance. Do not treat every product identically. Powder, liquid, and sticky materials respond differently.

Start with load-cell verification using traceable test weights. Check zero stability before production, then test several points across the operating range. Inspect vibration, air drafts, hopper contact, and material buildup. These details often create unstable readings. A clean calibration record can still hide poor installation.

Checkweighers require careful reference to OIML R 51, rather than R 61. Test them with certified weights at normal conveyor speed. Include product spacing, belt movement, and rejection timing. The FAO report The State of Food and Agriculture 2019 estimated that 14% of food is lost between harvest and retail. Giveaway is not the same as loss, but both expose weak process control. Sometimes, the machine is not the main problem. Operators may accept generous settings because they feel safer. That habit needs measurement, review, and correction.

2026 Best Ways to Reduce Product Giveaway in Filling Lines? - Calibrate Load Cells and Checkweighers Under OIML R 61 Accuracy Classes
Pack Format Nominal Quantity Recommended Weighing Configuration Relevant OIML R 61 Class Calibration and Verification Routine Illustrative Target Setting Giveaway Calculation Corrective Action When Variation Increases
Small sachet 25 g Load cell at the filler with a downstream checkweigher capable of resolving at least 0.1 g. X(1) or tighter
Select the applicable class according to the legal and process requirement.
Zero check before production; certified-weight check at start-up, after changeover, after cleaning, and at scheduled intervals. 25.25 g
1.0% process buffer
0.25 g per pack
25.25 − 25.00
Check vibration, air movement, product bridging, feeder timing, and the stability of the load-cell signal before increasing the target weight.
Single-serve pouch 50 g Net-weight filler with a dynamic checkweigher positioned after sealing. X(1) Verify repeatability with multiple certified test-weight placements; record mean, minimum, maximum, and standard deviation. 50.50 g
1.0% process buffer
0.50 g per pack
50.50 − 50.00
Separate random variation from a systematic offset. Re-zero the system only after confirming that the conveyor and weighbridge are clean and mechanically free.
Retail pouch 250 g Multihead or linear weigher feeding a conveyor checkweigher with automatic reject confirmation. X(1) Perform a certified-weight check at the beginning and end of each run; compare the checkweigher result with an independent reference scale. 252.50 g
1.0% process buffer
2.50 g per pack
252.50 − 250.00
Reduce feeder overshoot by tuning gate timing, product flow, discharge delay, and the stabilization time used by the checkweigher.
Carton or tub 500 g Gross-weight checkweigher with tare control and a stable infeed conveyor. X(1) or X(0.5) Confirm tare accuracy separately from net-content accuracy; test the reject device and verify that rejected packs cannot return to good product. 505.00 g
1.0% process buffer
5.00 g per pack
505.00 − 500.00
Investigate tare drift, carton moisture, product adhesion, conveyor transfer shock, and incorrect product recipes before changing the fill target.
Large bag 1 kg High-capacity load cell at the filling station plus a dynamic checkweigher rated for the complete package weight. X(1) or X(0.5) Use certified weights appropriate to the instrument capacity; verify corner-load response, zero stability, and repeatability during preventive maintenance. 1,010 g
1.0% process buffer
10 g per pack
1,010 − 1,000
Inspect load-cell mounting, frame contact, flexible connections, product buildup, and structural vibration. Do not compensate for mechanical faults by adding product.
Bulk sack 25 kg Weighing hopper or net-weigh filler with a high-capacity load-cell assembly and final static verification. Y(a) or applicable class
Confirm the permitted class for the instrument and application.
Check zero, span, repeatability, and eccentric loading using traceable test equipment; document environmental conditions and instrument status. 25.25 kg
1.0% process buffer
0.25 kg per sack
25.25 − 25.00
Review bulk-flow consistency, cutoff timing, sack support, filling pressure, dust interference, and whether the final weight is measured while the sack is still mechanically supported.
All formats Any declared quantity Calibrated filler load cells combined with a verified checkweigher and documented product recipe control. Class-specific Keep calibration records, test-weight certificates, zero and span results, failed-check investigations, corrective actions, and approval status for each product format. Process-specific Giveaway % =
(Average filled quantity − Nominal quantity) ÷ Nominal quantity × 100
Use the lowest stable target that satisfies the applicable legal, customer, safety, and process requirements. OIML R 61 accuracy classes do not create one universal giveaway percentage for every product.
Implementation note: OIML R 61 is a metrological framework for automatic gravimetric filling instruments. The applicable accuracy class, maximum permissible errors, verification procedures, and legal obligations must be confirmed against the current adopted edition and the regulations in the market where the product is sold. The numerical target settings above are transparent calculation examples, not universal legal tolerances.

Optimize Filler Settings with 30-Pack Control-Chart Monitoring

2026 Best Ways to Reduce Product Giveaway in Filling Lines?

A 30-pack control chart turns small filling errors into visible process signals. Weigh one complete 30-pack group at fixed intervals. Record the average, range, and heaviest unit. The average shows machine centering. The range reveals unstable dosing. Keep product temperature, hopper level, and line speed beside each reading. These details often explain sudden variation better than the scale alone.

The NIST/SEMATECH e-Handbook of Statistical Methods distinguishes common-cause variation from special-cause variation. Apply that principle before changing filler settings. Calculate control limits from stable production data, not customer specifications. If the average drifts upward for several groups, reduce the target carefully. If the range expands, inspect valves, pressure, or product density first. One adjustment at a time. Otherwise, the chart becomes difficult to trust.

The financial reason is substantial. UNEP’s Food Waste Index Report 2024 estimates 1.05 billion tonnes of food were wasted in 2022. Filling-line giveaway is only one part, but it is measurable. A practical trial can compare 30-pack averages before and after a setting change. For example, a 1-gram reduction across 10,000 packs saves 10 kilograms of product. That estimate assumes consistent pack count and accurate scales. It can be wrong. Moisture, settling, and operator timing still interfere. Review the chart daily, and question unusually perfect results.

Verify Net Contents Against OIML R 87 Average-System Requirements

Reducing product giveaway starts with measuring net contents correctly. In filling lines, the goal is not simply to make every package heavy. It is to control variation while meeting OIML R 87 average-system requirements.

The lot average must not fall below the declared quantity. Individual packages must also stay within permitted deficiency limits. These limits depend on the nominal quantity and product category. Measure net content, not gross weight. Confirm tare values regularly. A calibrated checkweigher and a controlled sampling plan can reveal drift before it becomes expensive. One heavy sample proves very little.

Small drifts matter. Review average results and individual deficiencies together. Track readings by filling head, shift, temperature, and product batch. When results approach a limit, adjust the filler in small increments. Large corrections may create new giveaway. Check nozzle wear, product density, pressure, and foaming. Document each change. The process is rarely perfect, and operators may miss a slow shift during busy production. That is why independent verification, traceable test weights, and periodic equipment calibration are essential. OIML R 87 should guide the inspection method, while local regulatory requirements should also be confirmed before release.

FAQS

What is product giveaway?

Product giveaway is extra product supplied above the declared net quantity. A few grams can become significant across thousands of packages. It is measurable loss.

How should a production baseline be created?

Sample different shifts, products, operators, and filling hours. Record gross weight, tare weight, net weight, temperature, and filling speed. Keep original readings, not only averages.

What might a baseline reveal?

A package marked 500 grams may average 506 grams. That six-gram difference shows where investigation should begin. The cause may be nozzle drip, unstable flow, or cautious settings.

Why can averages hide filling problems?

An average may conceal short periods of heavy overfilling. Review individual readings and time-based patterns. Small drifts matter.

What should be checked before changing filling targets?

Inspect nozzle condition, product flow, container variation, and equipment stability. Check temperature, pressure, product density, and foaming. Large corrections may create new giveaway.

How can weighing equipment be verified?

Use traceable test weights across the normal operating range. Check zero stability before production begins. Inspect vibration, air drafts, hopper contact, and material buildup.

How should checkweighers be tested?

Test them at normal conveyor speed with certified reference weights. Include product spacing, belt movement, and rejection timing. A clean calibration record can still hide poor installation.

How can teams verify net contents correctly?

Measure net content instead of relying on gross weight. Confirm tare values regularly and use a controlled sampling plan. Compare lot averages with individual package deficiencies.

How should operators respond when results approach a limit?

Adjust the filler in small increments and document every change. Track results by filling head, shift, temperature, and product batch. The process is rarely perfect, so independent verification remains useful.

Conclusion

Reducing product giveaway in filling lines starts with establishing a reliable baseline. By applying the principles of NIST Handbook 133, manufacturers can compare declared quantities with actual contents, identify average losses, and quantify the financial impact of overfilling. Fill variation should then be measured through statistical process control, using Six Sigma’s 3.4 DPMO benchmark as a performance reference. This approach helps teams distinguish random fluctuation from consistent equipment or process problems.

To determine how to reduce product giveaway in filling lines, facilities should regularly calibrate load cells and checkweighers according to applicable OIML R 61 accuracy classes. Filler settings can be optimized by monitoring 30-pack samples on control charts, allowing operators to correct drift before it becomes costly. Finally, net contents should be verified against OIML R 87 average-system requirements, ensuring that target fills remain accurate while maintaining compliance, stable production, and minimal unnecessary product loss.

Aria

Aria

Aria is a dedicated marketing professional with a deep passion for innovative strategies and a keen understanding of our company's product offerings. With a wealth of experience in the industry, Aria excels at crafting engaging content that highlights the unique features and benefits of our......